Recruiting analytics
The HR analytics dashboard for hiring.
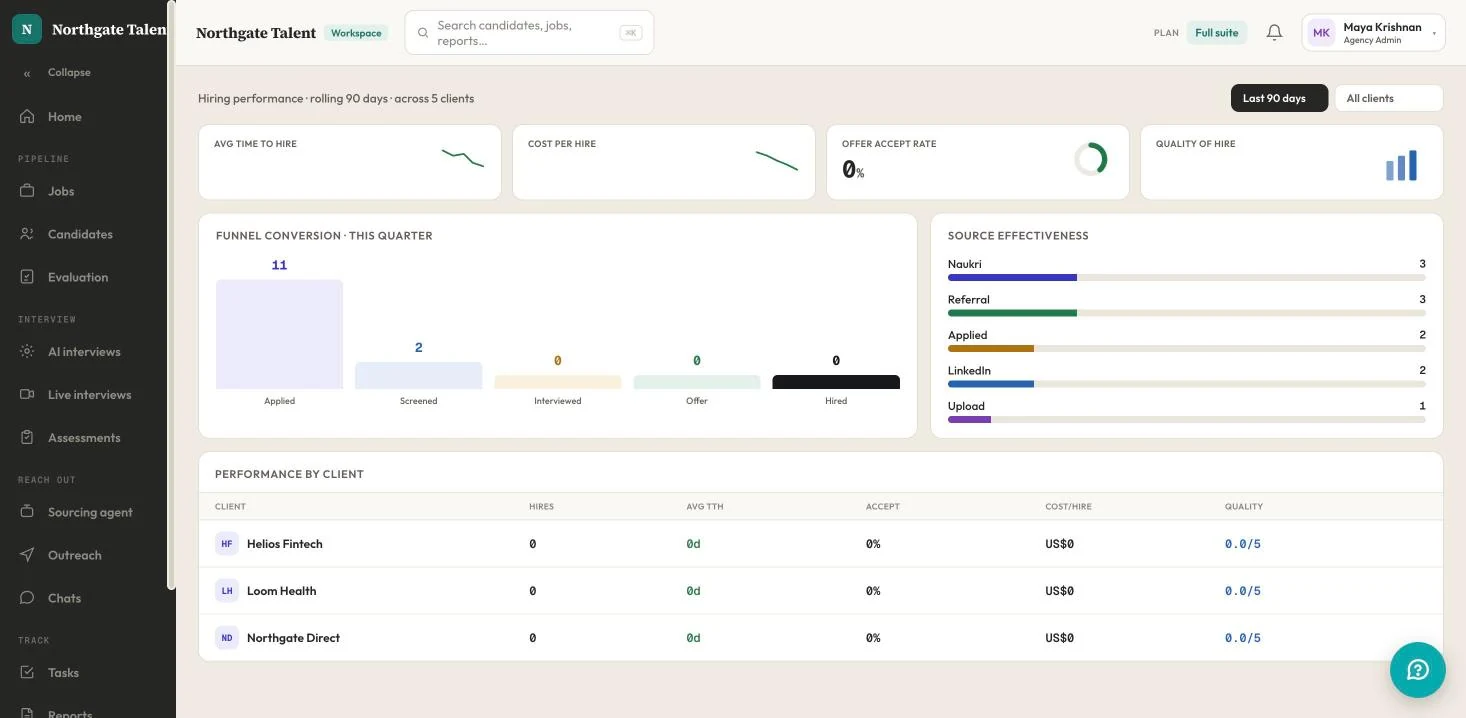
Time to hire, cost per hire, offer accept rate and quality of hire — computed from your own pipeline as it moves, not assembled in a spreadsheet at the end of the quarter.
What it answers
Four numbers, and what moved them.
Average time to hire
Measured from the real stage timestamps rather than estimated from a start and end date, so a role that sat waiting on a debrief for nine days shows those nine days where they happened.
Cost per hire
Rolled up per role and per source, in your own currency. For agencies it is also broken out per client, which is the number that decides whether an account is worth keeping.
Offer accept rate
The end of the funnel is where the expensive failures are. A strong accept rate on a slow pipeline and a weak one on a fast pipeline are different problems and want different fixes.
Quality of hire
Tracked against the scores the interview process actually produced, so you can see whether the people you rated highest are the people who worked out.
Where candidates drop out
The funnel, stage by stage.
Applied, screened, interviewed, offered, hired — with the conversion between each pair. Most hiring problems are one bad conversion wearing a disguise: a role that looks slow is often a role where eighty percent of applicants never got screened at all.
Conversion per stage
See which step is losing people rather than only that the role is taking too long. The stage with the worst conversion is where the next hour of your attention goes.
Source effectiveness
Which channels produce applicants and which produce hires, side by side. They are rarely the same list, and the gap between them is usually where the budget is being wasted.
Per-client performance
For agencies: hires, time to hire, accept rate, cost and quality for each client account, so a renewal conversation starts from evidence rather than impressions.
Any window you like
Seven days through twelve months, or all time. Short windows for whether last week's change worked, long ones for whether the process is actually improving.
Interviewer agreement
Scorecards are recorded per interviewer, so a panel where one person is consistently two points above everyone else stops being folklore and becomes something you can address.
Exportable, and in the API
Every figure is available through the REST API and as an export, so nothing here is trapped behind our charts if you already have a reporting stack.
Scope
What this does not measure.
This is a hiring dashboard. It does not track attrition, engagement, performance reviews, compensation bands or headcount planning, and it will not tell you why anyone left. If you are looking for HR analytics tools covering the full employee lifecycle, you want an HRIS with an analytics module, and we would rather say so now than after you have imported your data.
What it does cover, it covers from source: the numbers come out of the interviews and scorecards the platform already runs, so nothing has to be re-entered and there is no nightly sync to go wrong.
Questions about hiring analytics
- What is an HR analytics dashboard?
- A single view of the numbers that describe how your people processes are performing, drawn from the systems that already record them rather than from a survey. For hiring, that means the time, cost and outcome of each stage of each role, updated as the pipeline moves rather than compiled at quarter end.
- What is the difference between HR analytics and recruiting analytics?
- HR analytics normally covers the whole employee lifecycle: headcount, attrition, engagement, compensation and hiring. Recruiting analytics is the hiring part only. Recruit360 measures the hiring part — we do not track attrition, engagement or compensation, and this dashboard will not tell you why people leave.
- Which HR analytics tools do I need to start?
- Fewer than most teams assume. If your interviews and scorecards live in one place, the dashboard is a read of data you are already producing and needs no separate BI tool, warehouse or analyst. A dedicated analytics stack starts to earn its cost when you are joining hiring data to finance or HRIS data, which is the point at which you should export rather than replace.
- Where do the numbers come from?
- Your own pipeline. Stage transitions, interview scores and offer outcomes are recorded as they happen, so time to hire is measured from the actual timestamps rather than estimated. Nothing is modelled or benchmarked against other companies' data.
- Can I get the data out?
- Yes. Every view is exportable, and the same figures are available through the REST API, so you can join them to finance or HRIS data in whatever tool you already use for the rest of your reporting.
Keep reading
Get started
Stop reporting from memory.
Run one role through the platform and the dashboard fills itself in as the pipeline moves.
No card. 1 job free forever. Cancel by closing the tab.